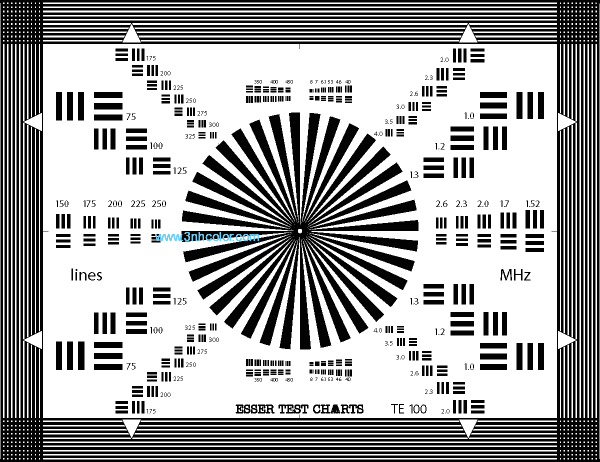

Sineimage YE0100 LENS FOCUS TEST CHART (SECTOR STAR)
|
Model |
YE0100 |
|
Type |
Reflectance/Transparent |
|
Size |
280 x 210mm (A280 or D240) |
|
Ratio |
4:3 |
| Material | Film or HD photographic paper |
The YE0100 lens focus test chart is designed for
• adjustment of camera lenses
• checking back focal distance
• checking resolution
• establishing cushion and barrel distortion
With the aid of a low transmission filter and by means of low level lighting make sure that the camera is not over modulated with the aperture in the open position.
a) Optical focus: Adjust focus of zoom lens at greatest focal length.
b) Back focal distance (lens): Adjust focus at shortest focal length by regulating lens mechanically with adjustment screw and optimize alternatively with a).
c) Back focal distance (pick-up tubes): If focus varies from channel to channel between greatest and shortest focal length, the individual pick-up tubes must be adjusted mechanically in the optical axis.
1. Select white channel. Set optical focus at greatest focal length. With shortest focal length and divergent focus adjust the pick-up tube in W-channel until optimum focus is achieved. If necessary optimize by alternating with optical focus adjustment.
2. With unchanged optical focus adjustment and shortest focal length adjust the red and blue pick-up tube until optimum focus is achieved. Image focus (focus adjustment) is maintained at all focal lengths (zoom-in) and constant distance from object by means of back focal distance adjustment.
The picture format is bordered by the 4 outlined arrows. 10 each black and white lines with a width of 0.5% of the picture height are located inside and outside the picture format. If the picture is adjusted to the arrow tips, cushion and barrel distortion can be read with the aid of the lines.
Beginning with 75 lines the bar patterns in the left part progress by 25 lines to 450 lines. In the right part the bar patterns are scaled in MHz, beginning with 1 MHz and ending with 8 MHz. The bar patterns progress by factor 5 √2.
Remark: We support Any customized test charts only if you have high resolution image and size.