SineImage YE042 Multi-functional Test Chart "Forty Two"
| Material | HD photographic paper |
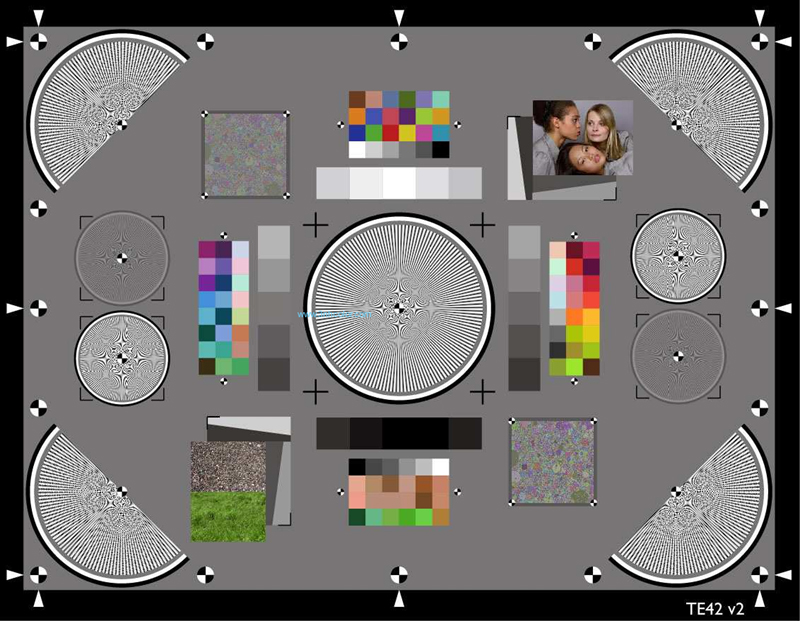
With the new version of the Test Chart “Forty Two” (TE42 Version 2) 3nh / Sineimage improved the successful multi-functional chart for testing digital cameras and lenses: With one single chart OECF (Opto Electronic Conversion Function), dynamic range, resolution, texture loss, shading, distortion, lateral chromatic aberration and color reproduction can be measured according to ISO standards. The chart can be analyzed with the corresponding software (iQ-Analyzer, until version 4 called IE-Analyzer). For analysis please use the individual reference files delivered with your chart.
The chart consists of several components:
OECF
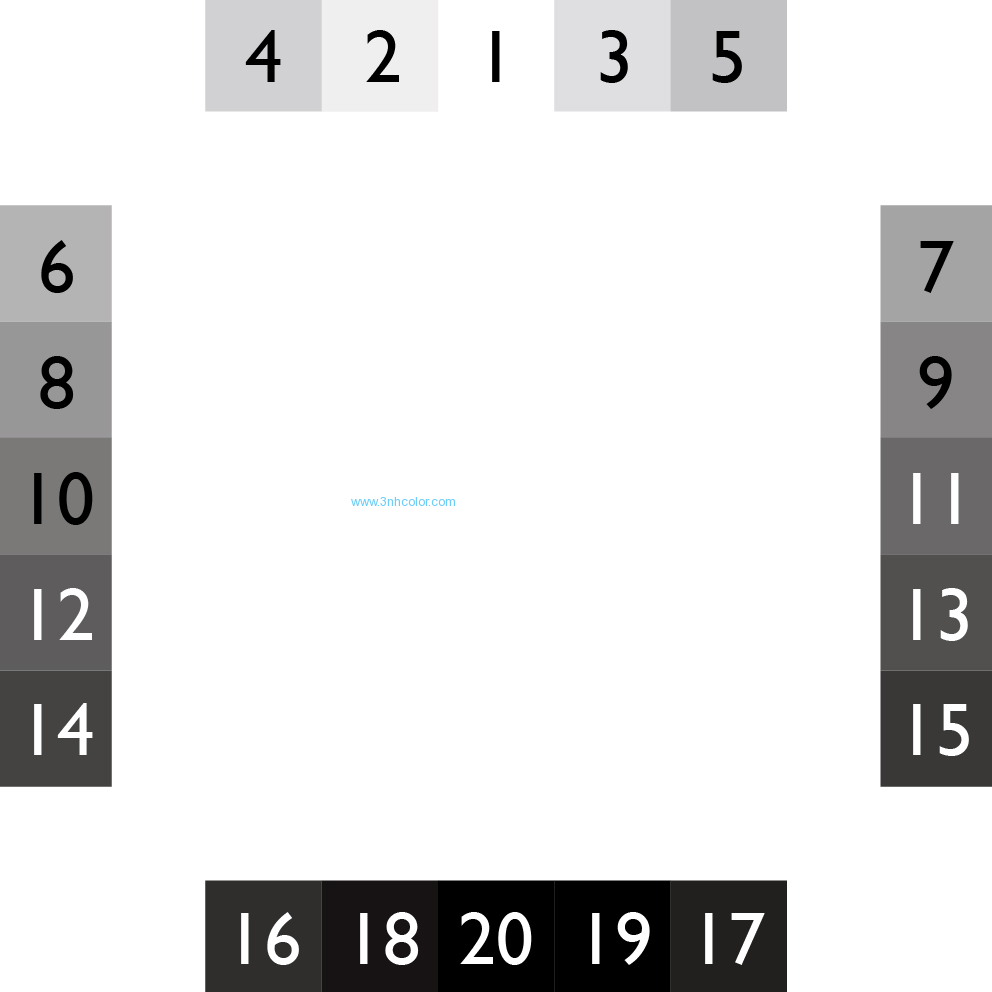
The gray scale, arranged around the central Siemens star, is used to determine the opto electronic conversion function (OECF). It describes how the digital camera transfers luminances into digital values. The patches are analyzed for all three color channels red, green and blue in color images. There are three significant characteristic values derived from the OECF: SNR (relation between signal and noise), Visual Noise (takes into account that the visual perception of noise can be different for observers compared to a mere SNR approach) and Dynamic Range (contrast in a scene reproduced by the digital camera).
|
|
Patch |
||
|
Step |
Measured |
Reference |
Deviation |
|
1 |
0.07 |
0.06 |
0.01 |
|
2 |
0.11 |
0.12 |
-0.01 |
|
3 |
0.20 |
0.19 |
0.01 |
|
4 |
0.25 |
0.26 |
-0.01 |
|
5 |
0.31 |
0.33 |
-0.02 |
|
6 |
0.40 |
0.41 |
-0.01 |
|
7 |
0.48 |
0.49 |
-0.01 |
|
8 |
0.56 |
0.58 |
-0.02 |
|
9 |
0.70 |
0.67 |
0.03 |
|
10 |
0.75 |
0.77 |
-0.02 |
|
11 |
0.90 |
0.88 |
0.02 |
|
12 |
0.98 |
1.00 |
-0.02 |
|
13 |
1.12 |
1.13 |
-0.01 |
|
14 |
1.25 |
1.28 |
-0.03 |
|
15 |
1.42 |
1.44 |
-0.02 |
|
16 |
1.66 |
1.63 |
0.03 |
|
17 |
1.85 |
1.86 |
-0.01 |
|
18 |
2.13 |
2.12 |
0.01 |
|
19 |
2.44 |
2.46 |
-0.02 |
|
20 |
3.00 |
3.00 |
0.00 |
|
Background |
0.82 |
0.80 |
0.02 |
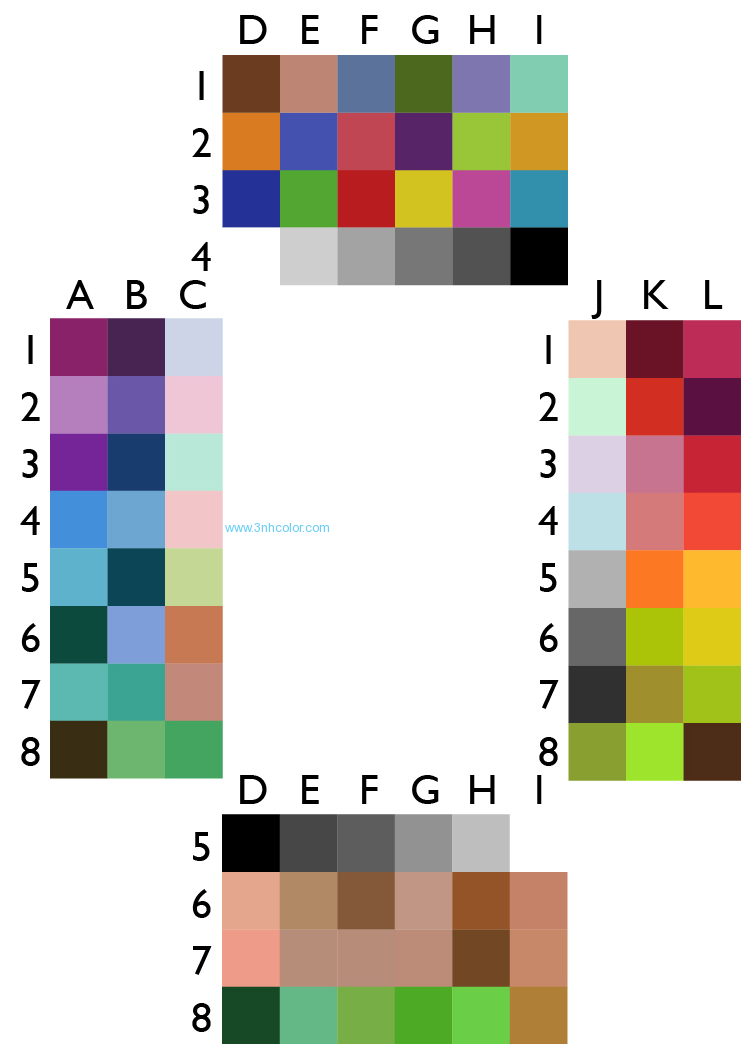
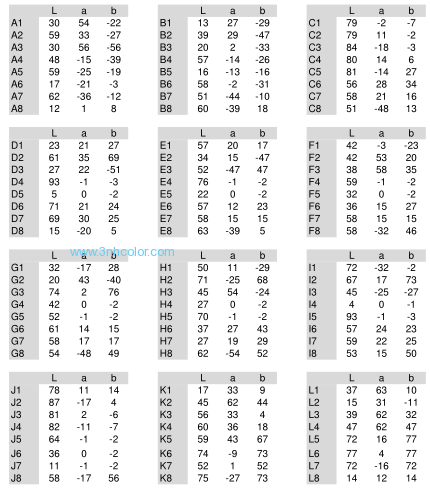
COLOR
The color patches, are arranged in four blocks around the OECF patches. They are based on the X-Rite ColorChecker SG and are used for evaluation of color reproduction. The patches are converted into color coordinates in the CIE L*a*b* color space (represents the color reception of the human visual system). From these values the color distance Delta E, that describes the color
reproduction quality, is calculated.
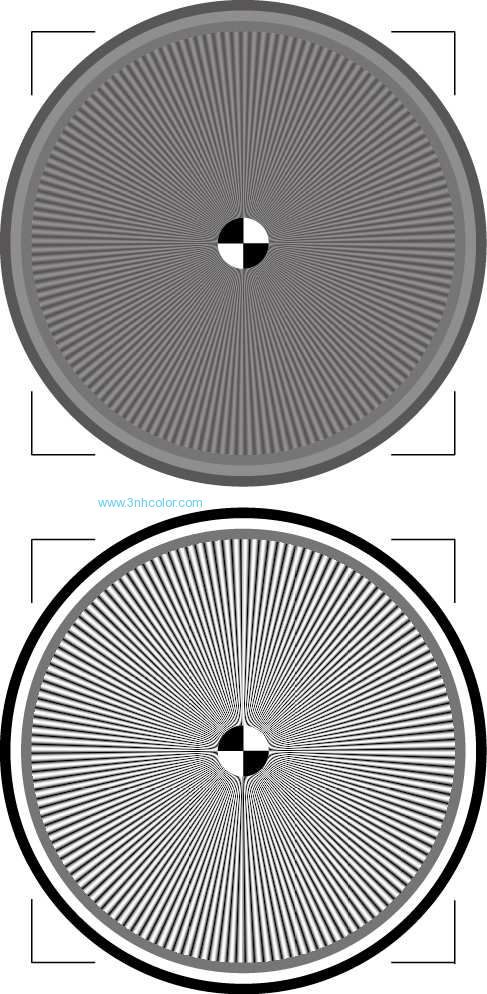
RESOLUTION / SIEMENS STARS
Resolution is measured in the center and the image corners using sinusoidal Siemens stars. There are 5 stars, one in the center and four half stars in the corners of the target. The stars are divided into segments and the resolution is measured for each of them. There are eight segments for the center star and three for each of the corner stars. Finally the mean value of the segments for each star and additionally for the corners, the mean value of all four stars gets reported.
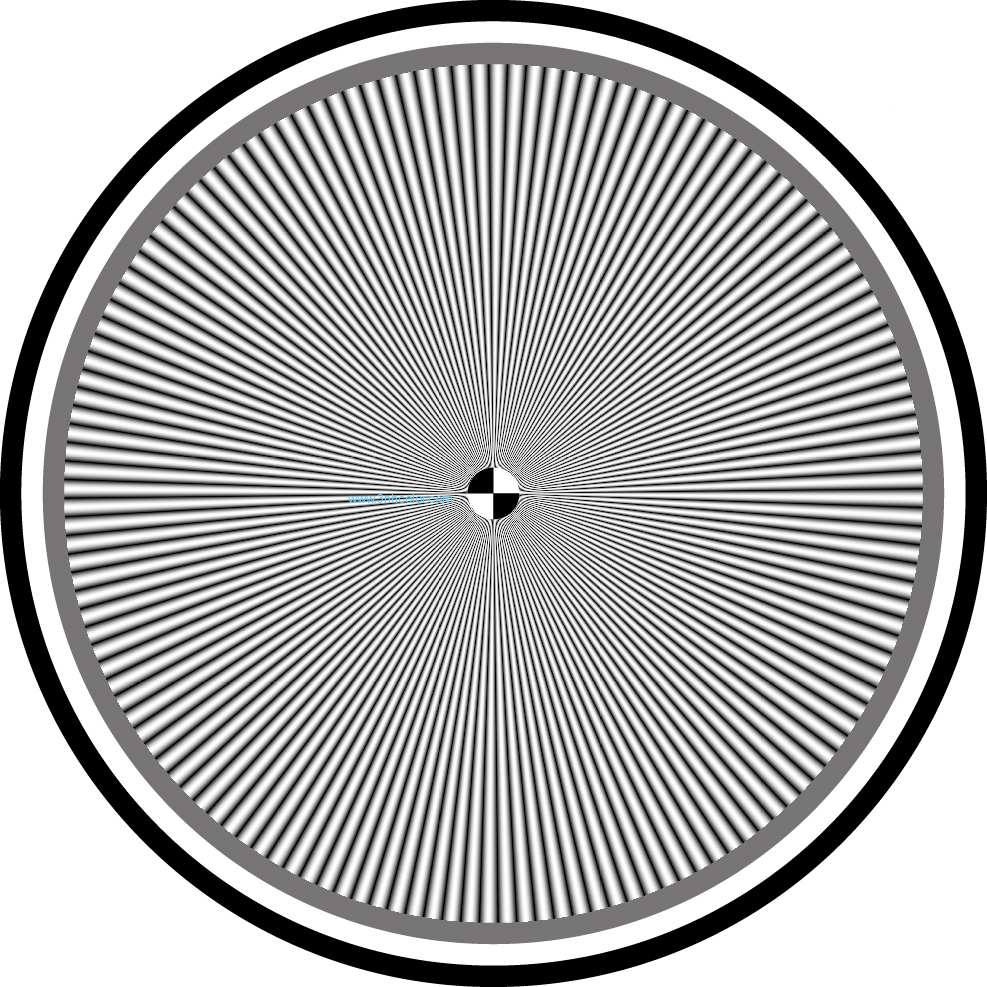
Two pairs of Siemens stars are included on the left and the right side of the chart. Each pair consists of one Siemens star with 100% modulation and one low contrast star with 20% modulation.
RESOLUTION / SLANTED EDGES
Two subcharts, each with a horizantal and a vertical edge, are included in the Forty-Two. The resolution is determined for each slanted edge.

TEXTURE LOSS
The analysis of the dead leaves pattern delivers a MTF. Shading describes the loss of light from the center of an image to the corner and is measured using the gray background.
The metric 'texture loss' describes the treatment of fine details with low contrast by an imaging system. The dead leaves structure is developed to assess this phenomenon.
It is made of circels in all sizes and colors at a limited contrast level. A fourier transform of an image of this structure taken with a camera provides the power spectrum that the camera is able to reproduce. In 2014 the dead leaves structure and the analysis were improved by Image Engineering.
The Forty-Two version 2 contains two patches of the latest dead leaves developement at different contrast levels.
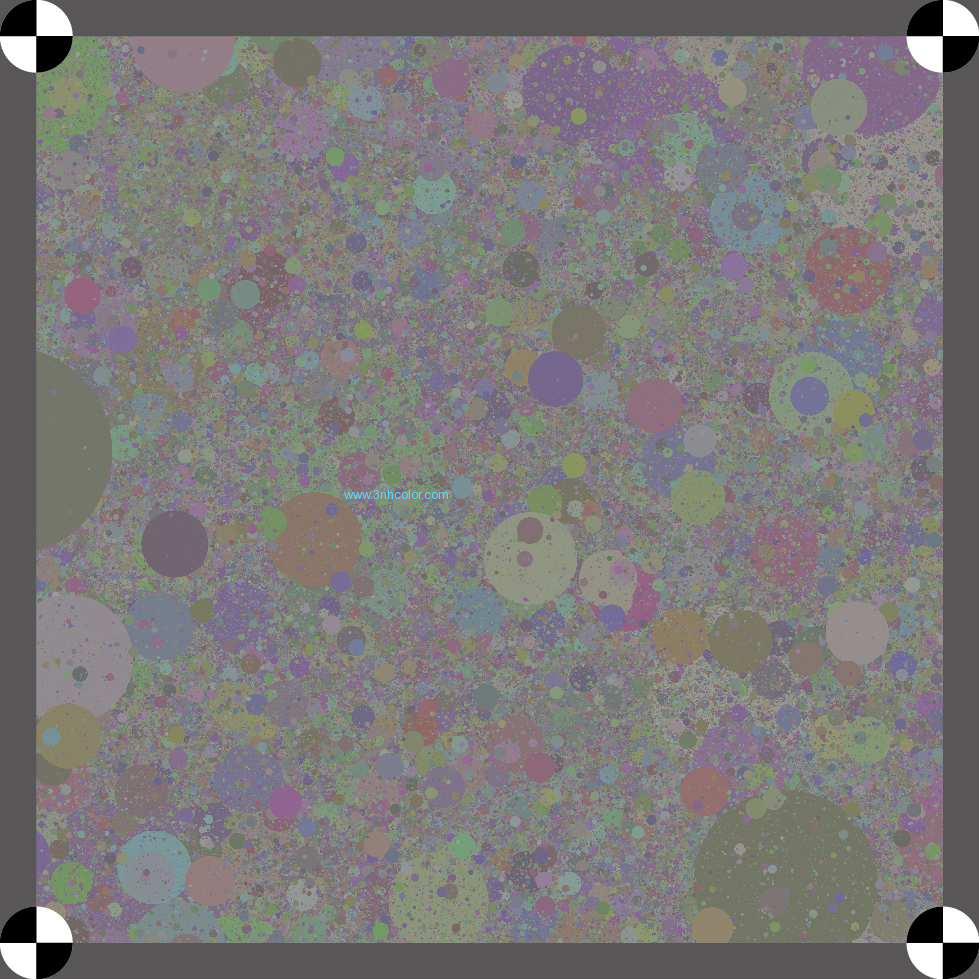
The analysis of the dead leaves pattern delivers a MTF.
SHADING
Shading describes the loss of light from the center of an image to the corner and is measured using the gray background.
DISTORTION
Distortion is an geometrical aberration caused by the lens that results in a variation of the scale over the image height. Original straight lines look curved. Distortion is measured by using the marks. This structure is also used to determine the lateral chromatic aberration. A scale factor depending on the wavelength of the light that results in color fringes around high contrast structures in the corners of an image.
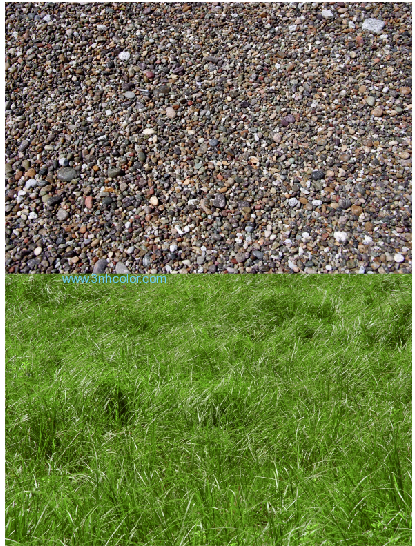
VISUAL APPRAISAL
For a visual appraisal of reproduction of details, structures and skin tones in the digitalization process several patches are included in the Forty-Two.