Sineimage YE0232 Log.Gray Scale/Color Test Chart
| Material | HD photographic paper |
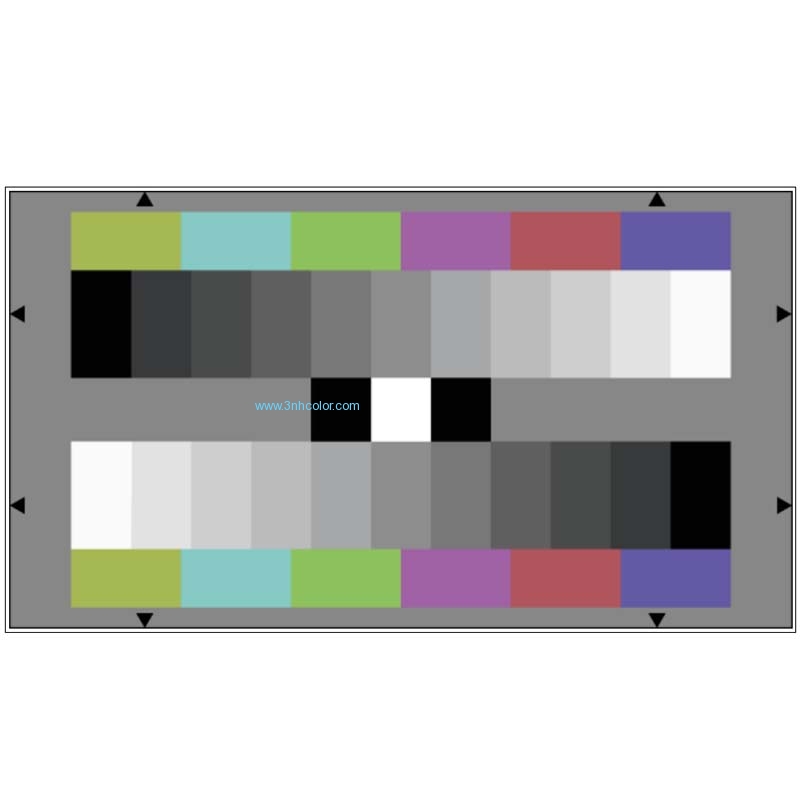
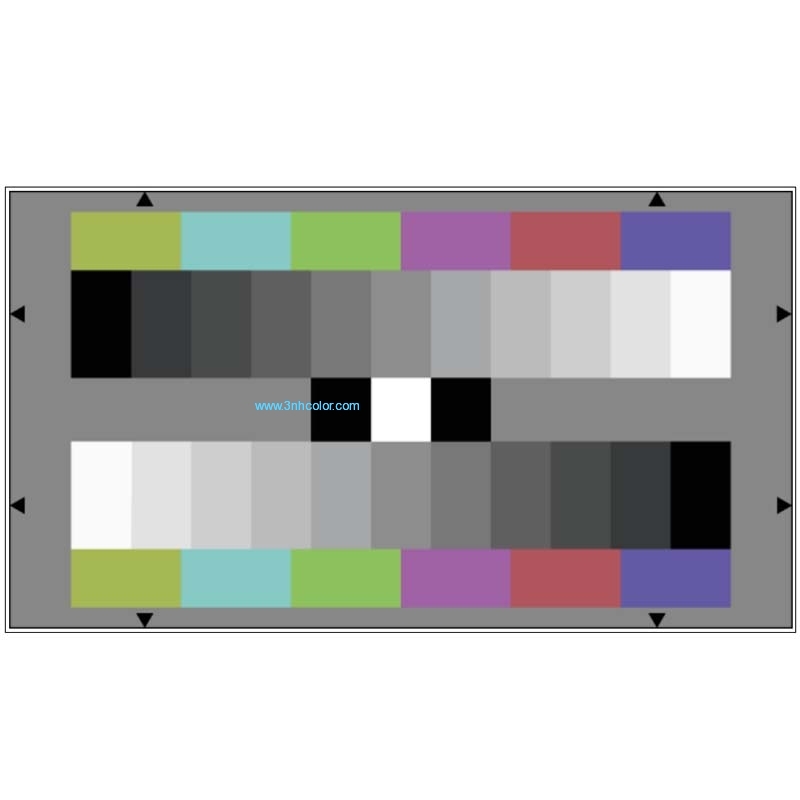
The YE0232 is designed for the evaluation of the halftone and color reproduction of an electronic camera.
Two 11-graduated counter current gray scales are arranged on a gray background (D≈0.62, remission=24%), the gray scale being graduated logarithmically. Related to the densities of the gray scales: gamma = 0.45 , related to the remission values (brightness): gamma = 2.2, that being exactly the reciprocal value of 0.45.
The gamma factor 0.45 applies to remission > 1.8% (brightest step 100%). Between 0 and 1.8% the gamma function shows a linear progression (with the factor 4.5). The darkest step is in this area. The gamma function corresponds to Rec.709. The output of an optimally gamma-corrected camera yields two 11- graduates counter current linear step signals (see figure below, without the color signals). The dynamic range of the gray scales is 63 : 1.
The values of the 13-graduated gray scale are as follows:
| Step | Density | Reflectance in % |
| 1 | 0.05 | 89.2 |
| 2 | 0.14 | 72.3 |
| 3 | 0.23 | 59.1 |
| 4 | 0.33 | 46.5 |
| 5 | 0.45 | 35.6 |
| 6 | 0.58 | 26.3 |
| 7 | 0.73 | 18.5 |
| 8 | 0.91 | 12.2 |
| 9 | 1.14 | 7.3 |
| 10 | 1.43 | 3.7 |
| 11 | 1.85 | 1.4 |
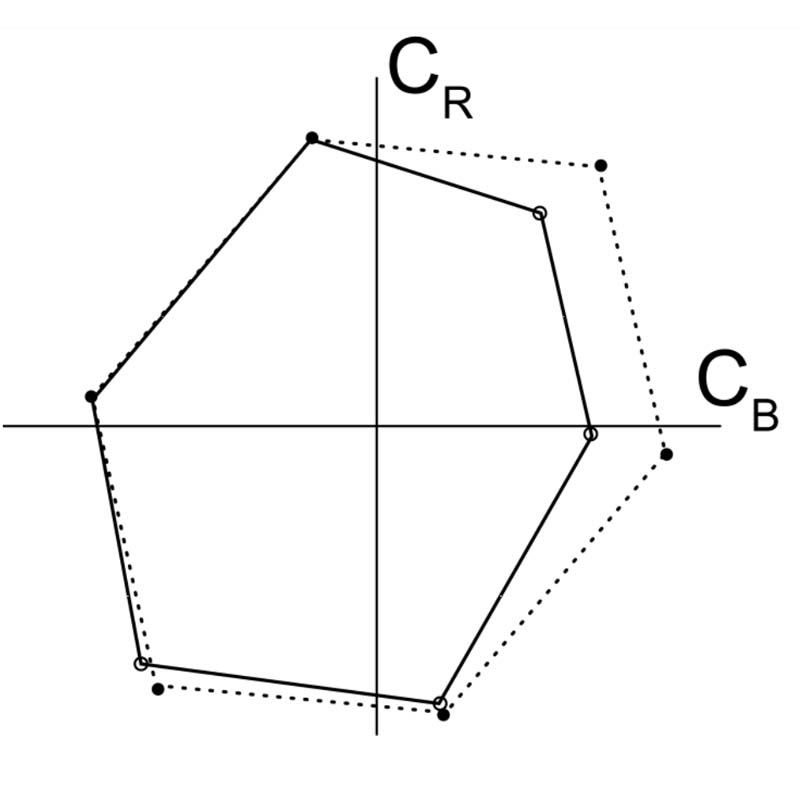
The color patches represent the three primary colors red, green and blue as well as the three secondary colors cyan, purple and yellow. Since it is impossible to depict the 100% saturated colors on a reflectance chart, the saturation is reduced to 70% and at the same time a whitening of 30% was determined. The RGB signal for red thus should be 70% red; 30% green and 30% blue. The other colors are determined accordingly. In order to generated these RGB colors in the gamma the colors of the test chart were calculated with the matrixing and gamma algorithms according Rec. 709. The color of the test chart represent a best possible approximation to these nominal values.
The following diagram shows the nominal values (dotted line) and the actual values.
●……● theoretical values(acc.Rec.709)
●——● YE0232
●……● theoretical values(acc.Rec.709)
●——● YE0232