TE224 A HDTV Resolution Test Chart 50-1000 CPH 16:9 Reflectance
TE224 A HDTV Resolution Test Chart 50-1000 CPH 16:9 Reflectance
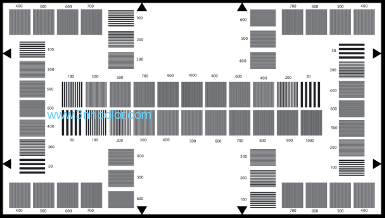
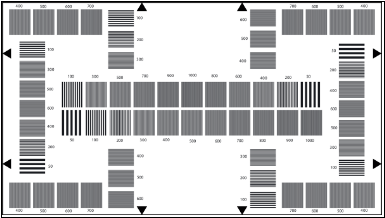
The TE224 HDTV Resolution Test Chart is designed to measure and describe the frequency response of an electronic HDTV camera.
The test chart consists of 50 multiburst fields, which are distributed over 16:9 picture area. The fields are arranged in horizontal and vertical direction to measure resolution in both directions. All fields are designated with figures, which give the resolution in cycles per picture height. A cycle consists of on black an white TV line.
The two rows in the middle are arranged differently. The upper row takes into account, that the highest resolution is in the middle of the picture. Therefore the 1000 cph field is in the middle and frequencies decrease to both sides.
In the lover row the frequencies increase from the 50cph on the left to the 1000 cph on the right. The row can be used to measure and describe the frequency response of the camera checked.